
By Rohit Sharma
A comparison between two Big Data monitoring tools based on different dimensions along with their pros and cons for using the right one according to the need. Let’s assume the system is running smoothly in production, that system can be a dense network of servers or an integration mechanism between several databases. Now after the deployment, the user’s job is to make sure that it keeps running smoothly, so that it must be possible to take required actions instantly whenever there is a problem. These actions mainly consist of detecting, decoding and fixing the problem as soon as possible. These detecting and decoding tasks seem a little bit tedious. That is where the question arises, “Can something be done to make these tasks automatic?”
And the answer is “Yes!”.
There are so many Big Data monitoring tools available, and all appear valid: high-performance, highly reliable stacks built specifically to manage large amounts of data. In this blog, Let’s cover the two famous stacks, TICK and ELK.
Introduction to TICK Stack And ELK Stack
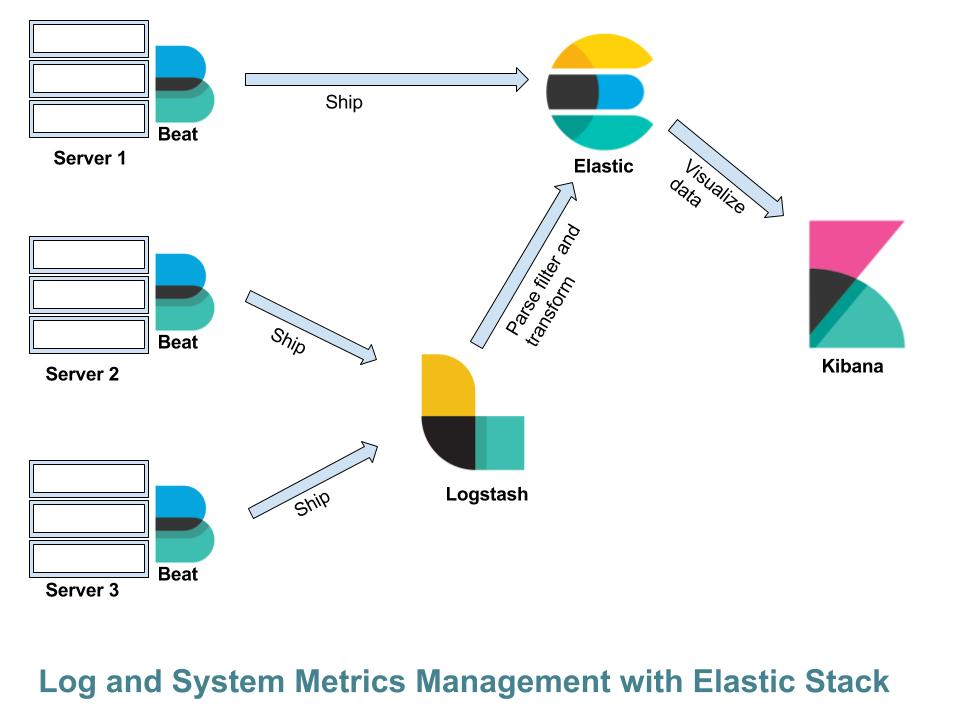
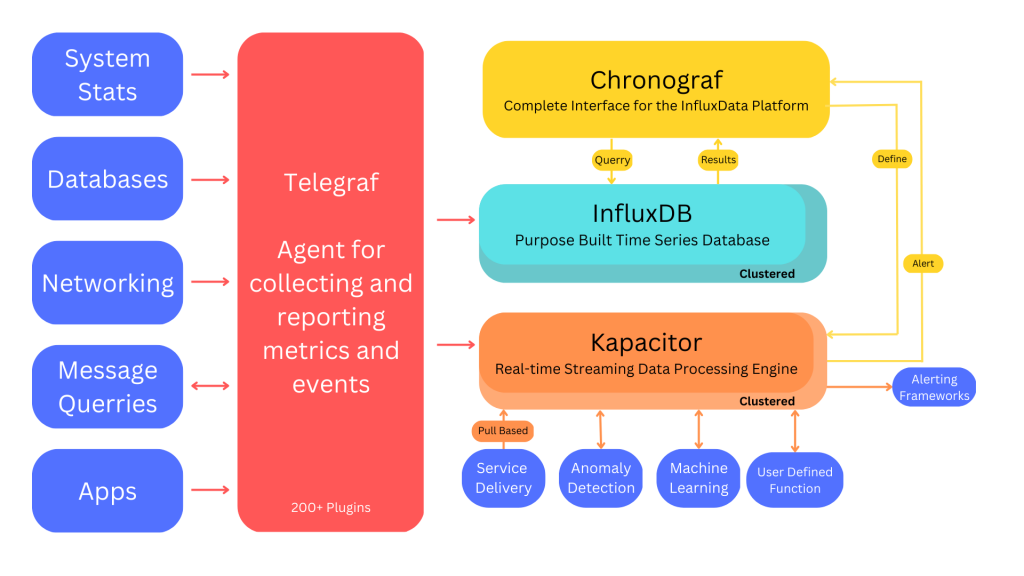
In the last few years, it is noticed that these stacks have become standard among the many projects in this area. The ELK stack was developed under the Elasticsearch project, and the TICK stack was mainly developed keeping the storage of time series data in mind. These stacks have many points of contact. Their acronyms indicate the components. ELK stands for Elastic, Logstash, and Kibana and TICK stands for Telegraf, Influx, Chronograf and Kapacitor.
In both stacks, components can be used at will for monitoring system metrics such as CPU, RAM etc, analyzing log files, monitoring applications, constructing alerting and creating dashboards for real-time analysis. ELK and TICK have been developed in the open-source field even if they offer enterprise and cloud solutions. Differences between ELK and TICK can be examined by contemplating 4 dimensions of analysis:
● Processing data from unstructured data sources(such as logs)
● Receiving system metrics
● Querying stored data
● Configuring alerting tools
Processing of data from unstructured data sources
The acquisition and processing of unstructured data like logs is the base of the ELK stack. Log data can be stored directly in ElasticSearch or, if the processing is required, it can go through Logstash, which is used for parsing the data. In TICK stack, the corresponding tool is a Telegraf plugin that parses the data in a single moment which Filebeat and Logstash perform separately. Hence it deals with both log acquisition and parsing. For this purpose, the ELK stack with Filebeat and Logstash seems more stable, whereas the Telegraf plugin still looks less sophisticated. Logstash has several input plugins and filters like grok, dissect etc to manipulate
unstructured data at will. Also, the ELK stack has the Elastic engine which is perfect for storing textual data with full-text searches.
Receiving system metrics
Tracking system metrics like CPU & RAM, usage of systems, dockers, etc. are the most important aspects of monitoring with the TICK stack. Telegraf consists of several input plugins to collect system metrics for different operating systems, and “containerized” applications using docker for both relational and non-relational databases. These input plugins are so easy to configure, almost plug & play. Also, in the ELK stack, there is an agent for this task, Metricbeat.
MetricBeat consists of modules for monitoring systems, dockers, and databases. It is conceptually similar to Telegraf input plugins. For monitoring of the logs, the ELK stack is more stable and for collecting system metrics the TICK is more stable because it can send the output to other databases except for InfluxDB whereas Metricbeat has an ElasticSearch privileged channel.
Querying stored data
Lucene queries and flux queries are used for querying the stored data from the respective databases of these stacks i.e ElasticSearch for ELK and InfluxDB for TICK. Lucene query is more data value-oriented query as compared to flux query. Flux queries have data aggregation functions, which makes TICK stack more suitable and flexible in terms of querying the stored data as compared to ELK stack.
Configuring alerting tools
In the TICK stack, alerting is managed through two components, first is the Chronograf web interface and the second is Kapacitor which is the data processing framework. Using these components, It’s easy -:
- Defining thresholds.
- Enabling and disabling alert rules using TICK scripts.
- Creating dashboards in real-time which is completely dragging & dropping things.
- Sending alerts via email, Slack and other channels.
Also, in the ELK stack, there is a component called Watcher which is dedicated to alerting. It has the same features as the TICK but is only available with the Elastic Gold license.
TICK or ELK?
So, which stack is better, TICK or ELK?
Still, Confused? Don’t be. Here are some pros & cons of these stacks.
TICK Stack
Here are some pros and cons of TICK:
Pros
● Lightweight binaries (Go) – Easy to install.
● Excellent metric support – Columnar storage with high compression.
● Stores int, float, text and bool natively.
● “SQL-inspired” query language is easy to get started with.
● Inline data processing via “continuous queries” and “subscriptions”.
Cons
● InfluxQL differences from SQL soon become apparent – single and double quotes are very different!
● Kapacitor has yet another language too – “TICKScript”. The plan is to unify in InfluxDB 2.0 (“Flux”).
● Alerting is hard to set up, and not too intelligent.
● A columnar database isn’t really suited to event logs. Cannot have two “rows” with the same timestamp (but has nanosecond resolution) and text search is a brute-force full-column scan.
● Maybe unpredictable RAM usage and database corruption (but much improved).
● Horizontal scaling only in commercial cluster products.
ELK Stack
Here are some pros and cons of ELK:
Pros
● Long-standing and widely deployed – cloud-hosted services available or DIY.
● Fast free-text searching.
● Can be scaled horizontally.
● Rich data model, including first-class support for IP addresses.
● Wide range of useful Beats, inc. Winlog.
● Logstash supports Netflow.
● Elasticsearch is also a component of many platforms including Security Onion, Graylog, SIEMonster etc.
Cons
● X-Pack Alerting is a commercial add-on.
● Huge resource requirements – SSD recommended; but index typically 10 times larger than the ingested data, has large RAM requirements and it’s all Java (apart from Beats).
● Explicit time sharding is usually required for e.g. creating a separate index per day.
● Not suited to metrics because it’s expensive to scale up. Logstash finally released the SNMP input plugin in October 2018.
● Questionable reliability as a primary data store.
Conclusions
Overall, both tools offer the same functionality, but each has its own strengths and weaknesses. The TICK stack is naturally and effectively good at monitoring metrics and alerting, whereas the ELK stack is good at analyzing textual or unstructured data, hence it is able to do detailed analyses punctually. Both solutions can be used in a parallel and complementary way to build a complete monitoring architecture. So, choosing the right is up to the situation & requirements.


Leave a comment