
By Muskan Verma
Now-a-Days we are dealing with bulk data coming from various resources, There are so many tools to manage our data like mysql, mongodb, influx db, etc. Once the data is received, it needs to be monitored continuously, and changes need to be made according to the requirements, in other words collecting data (usually in the form of time series data) would then require a massive amount of effort to go through and make sense out of it, So larger the data, more monitoring time would be needed.
Here is when Grafana comes into the picture along with various questions like
What is Grafana?
Grafana is an open-source analytic and interactive visualization web application. It allows users to ingest data from a huge number of data sources, query this data and display it on beautiful customizable forms for easy analysis.
Databases it supports?
Grafana supports various kinds of databases and it provides ease of choosing any database of the like. some examples are MySQL, MongoDB, influx db and many more, so one can just select the database and provide some basic information such as database name, user, password, etc and wallah!
Now comes the fun part
Features
In Grafana monitoring is achieved using panels. The basic building block for visualization in Grafana is the panel, and that panel may contain a graph, a Singlestate, a table, a heatmap, and freetext, and Users are free to customize the style and format of each panel, and they can drag, drop, and resize them as they wish to create the ultimate visualization to suit their needs, can also install plugins from the official site if they require something that is not present by default like in version 8.4.3 pie chart visualization is not present by default but one can easily install that plugin and use it.
Different panels can be created for different queries. What if one wants to show related panels under one roof? The solution is a dashboard. So, a Dashboard is a collection of panels, each of which holds a set of variables (like sensor name, application, and server). These panels are arranged in a grid on the Grafana dashboard, and the user can change the data being scrutinized by switching variables, and that could be data from two different servers, for instance. Although the flexibility to customize views is one of the strongest Grafana features, users can just as easily pick up one of many ready-made dashboards to handle different data types and sources. Grafana’s large community of users and contributors has already created lots of them.
One can also send alerts via email, discord, telegram etc any platform by providing minimum details.
But the catch here is that in the database, there must be a column of timestamp and its name should be time, it is compulsory and the user cannot change it otherwise the output generated will not be the expected one.
One of the features of grafana is the user can decide what they can show and provide read-write options according to the role of the user.
Common Grafana features:
- Visualize: Grafana has a feature of visualization options to help the user understand data from graphs to histograms to many more.
- Alerts: Grafana lets the user define thresholds(Conditions when not matched) visually, and get notified via Slack, PagerDuty, mail and more.
- Datasource: user can bring their data together to get a better context. Grafana supports dozens of databases, natively.
- Open-Source: Grafana is completely open-source. A person can use Grafana Cloud or can easily install it on any platform.
- Display dashboards: Visualize data with templated or custom reports and create and share reports.
Below are some of the screenshots:
Sending Alert via email:
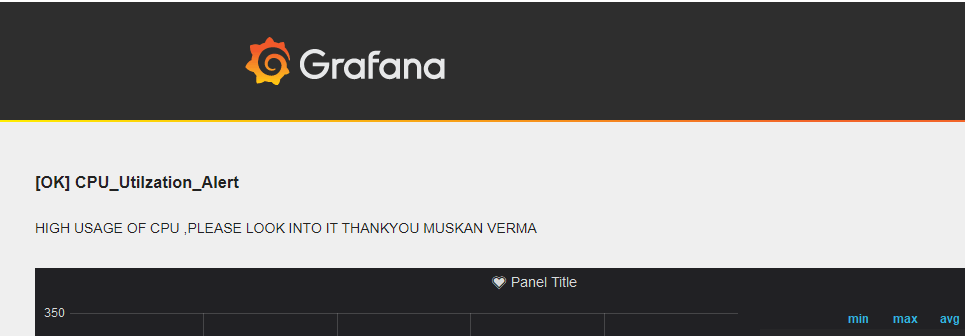
Anyone can easily set up the conditions so that when the condition doesn’t match their requirement then they’ll get notified. (not only email, can also use other platforms also as mentioned above)
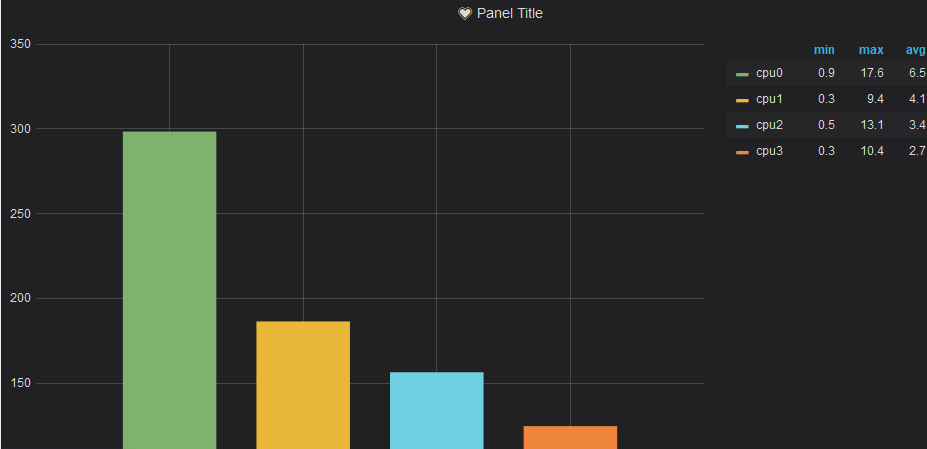
Panels:
A panel is something that one has created using visualizations and databases
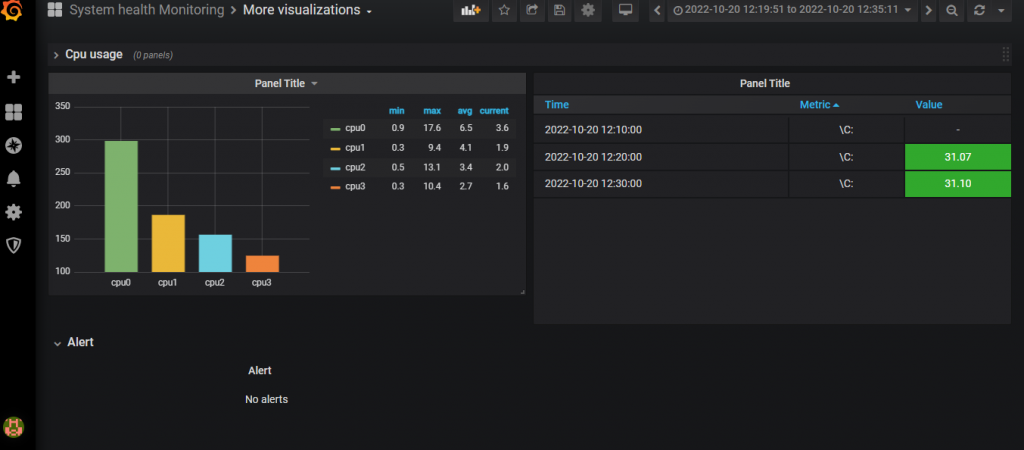

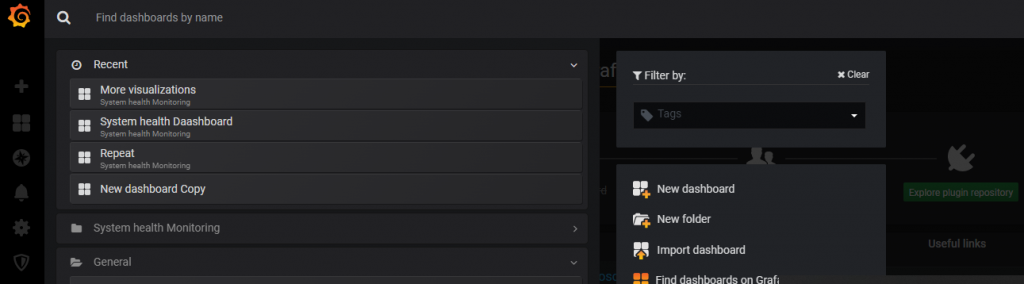
Dashboard:
The collection of such panels is a dashboard. One can give the name of the dashboard and a general description of it so that the person can know which dashboard is used for what purpose.
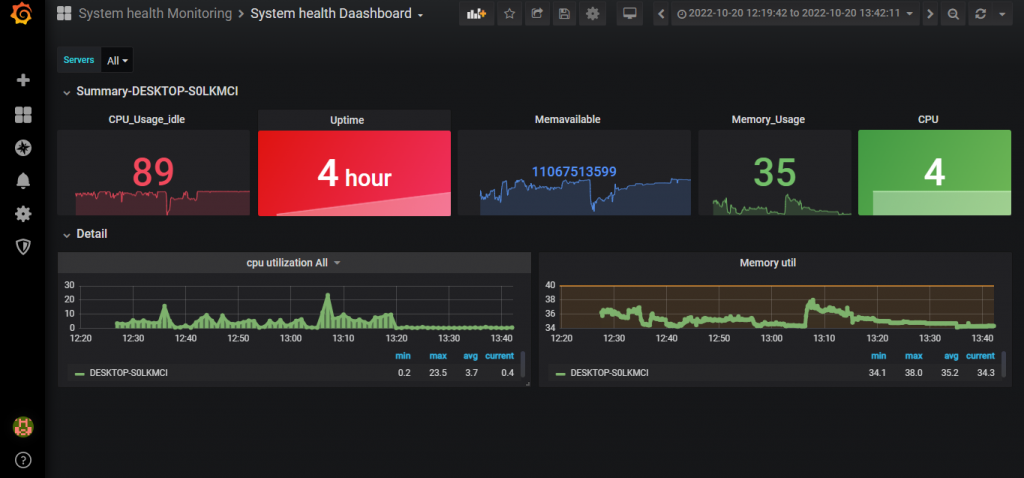
Server:
If someone is using a different server in the same dashboard they can filter out which server they want.

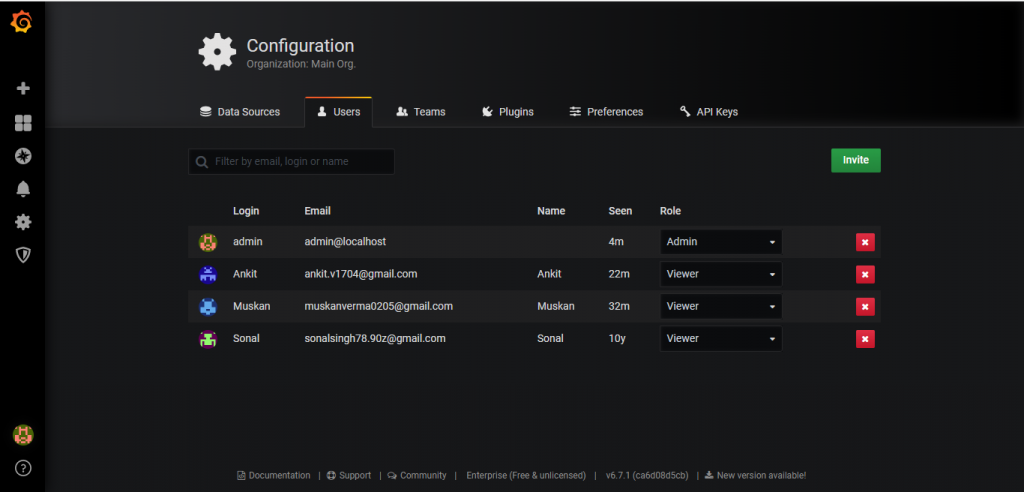
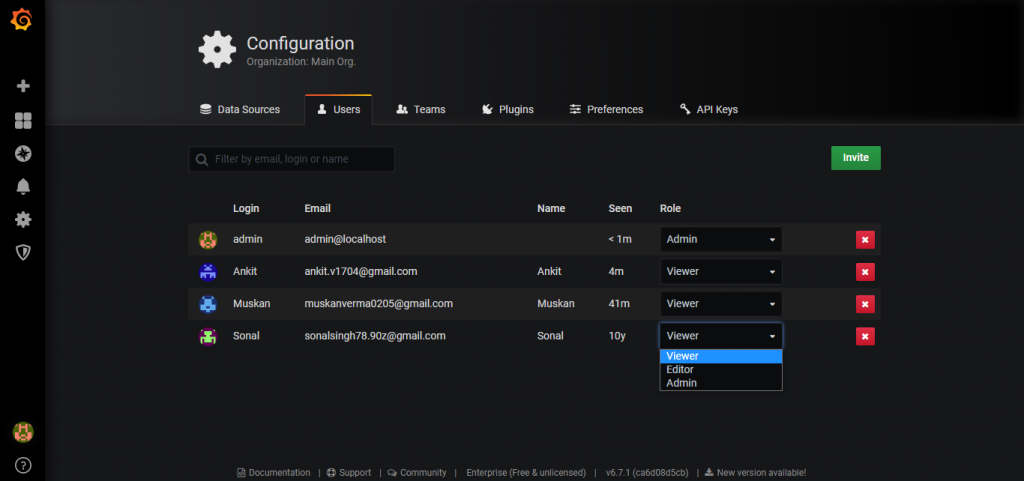
Roles And Privileges:
In grafana, if a person wants anyone to make changes or be able to change the output, only the concerned person should have the right to do it, it can be easily done in grafana by creating different roles for users and can provide privileges accordingly.
Datasource:
Grafana supports various data sources like MySQL, elasticsearch, and influx so one can easily choose any data-source according to the requirement.
Tips:
- Whatever database opted for must contain a field name time and datatype of timestamp.
- If the OS is windows and the person is using influx DB, then go on the official site and extract it at the desired location, in that zip file the user will get influx and influxd for writing queries using its shell.
- Similarly, with telegraf open cmd at telegraf location then run these two commands.
telegraf.exe -service install —>run,
net start telegraf——>run,
now open influx shell and write the command show databases, it’ll automatically create one database as ‘telegarf’
- By default the username and password for grafana are admin.
- After adding the data-source, it is recommended to test the data source.
Conclusion
Security analysts, and developers all use this data to guide their decisions. Companies that rely on database analytics and visualization tools like Grafana are far more profitable than their peers.
Grafana reveals to teams and companies what their users actually do, not just what they say they do. Grafana makes that data useful again by integrating all data sources into one single organized view, users aren’t very known at predicting their own behaviors. Having analytics allows tech teams to dig deeper than human-error-prone surveys and monitoring.
In the upcoming era of data science & analytics, grafana will be proven as one of the most effective tools.


Leave a comment